2.3.1 GDB
gdb 的组成架构
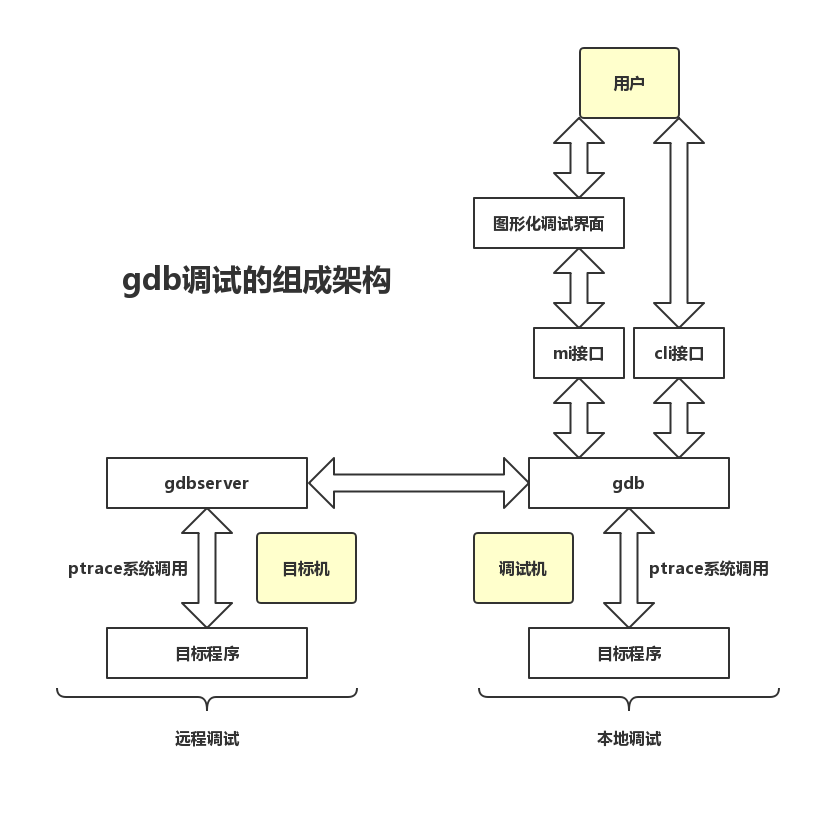
gdb 基本工作原理
gdb 通过系统调用 ptrace 来接管一个进程的执行。ptrace 系统调用提供了一种方法使得父进程可以观察和控制其它进程的执行,检查和改变其核心映像以及寄存器。它主要用来实现断点调试和系统调用跟踪。ptrace 系统调用的原型如下:
#include <sys/ptrace.h>
long ptrace(enum __ptrace_request request, pid_t pid, void *addr, void *data);
- pid_t pid:指示 ptrace 要跟踪的进程。
- void *addr:指示要监控的内存地址。
- void *data:存放读取出的或者要写入的数据。
- enum __ptrace_request request:决定了系统调用的功能,几个主要的选项:
- PTRACE_TRACEME:表示此进程将被父进程跟踪,任何信号(除了
SIGKILL)都会暂停子进程,接着阻塞于wait()等待的父进程被唤醒。子进程内部对exec()的调用将发出SIGTRAP信号,这可以让父进程在子进程新程序开始运行之前就完全控制它。 - PTRACE_ATTACH:attach 到一个指定的进程,使其成为当前进程跟踪的子进程,而子进程的行为等同于它进行了一次 PTRACE_TRACEME 操作。但需要注意的是,虽然当前进程成为被跟踪进程的父进程,但是子进程使用
getppid()的到的仍将是其原始父进程的 pid。 - PTRACE_CONT:继续运行之前停止的子进程。可同时向子进程交付指定的信号。
- PTRACE_TRACEME:表示此进程将被父进程跟踪,任何信号(除了
gdb 的三种调试方式
- 运行并调试一个新进程
- 运行 gdb,通过命令行或
file命令指定目标程序。 - 输入
run命令, gdb 执行下面的操作:- 通过
fork()系统调用创建一个新进程 - 在新创建的子进程中执行操作:
ptrace(PTRACE_TRACEME, 0, 0, 0) - 在子进程中通过
execv()系统调用加载用户指定的可执行文件
- 通过
- 运行 gdb,通过命令行或
- attach 并调试一个已经运行的进程
- 用户确定需要进行调试的进程 PID
- 运行 gdb,输入
attach <pid>,gdb 将对指定进程执行操作:ptrace(PTRACE_ATTACH, pid, 0, 0)
- 远程调试目标机上新创建的进程
- gdb 运行在调试机上,gdbserver 运行在目标机上,两者之间的通信数据格式由 gdb 远程串行协议(Remote Serial Protocol)定义
- RSP 协议数据的基本格式为:
$..........#xx - gdbserver 的启动方式相当于运行并调试一个新创建的进程
注意,在你将 gdb attach 到一个进程时,可能会出现这样的问题:
gdb-peda$ attach 9091
Attaching to process 9091
ptrace: Operation not permitted.
这是因为开启了内核参数 ptrace_scope:
$ cat /proc/sys/kernel/yama/ptrace_scope
1
1 表示 True,此时普通用户进程是不能对其他进程进行 attach 操作的,当然你可以用 root 权限启动 gdb,但最好的办法还是关掉它:
# echo 0 > /proc/sys/kernel/yama/ptrace_scope
断点的实现
断点的功能是通过内核信号实现的,在 x86 架构上,内核向某个地址打入断点,实际上就是往该地址写入断点指令 INT 3,即 0xCC。目标程序运行到这条指令之后会触发 SIGTRAP 信号,gdb 捕获这个信号,并根据目标程序当前停止的位置查询 gdb 维护的断点链表,若发现在该地址确实存在断点,则可判定为断点命中。
gdb 基本操作
使用 -tui 选项可以将代码显示在一个漂亮的交互式窗口中。
break -- b
break当不带参数时,在所选栈帧中执行的下一条指令处设置断点。break <function>在函数体入口处打断点。break <line>在当前源码文件指定行的开始处打断点。break -Nbreak +N在当前源码行前面或后面的N行开始处打断点,N为正整数。break <filename:line>在源码文件filename的line行处打断点。break <filename:function>在源码文件filename的function函数入口处打断点。break <address>在程序指令的地址处打断点。break ... if <cond>设置条件断点,...代表上述参数之一(或无参数),cond为条件表达式,仅在cond值非零时停住程序。
info
info breakpoints -- i b查看断点,观察点和捕获点的列表。info breakpoints [list…]info break [list…]list…用来指定若干个断点的编号(可省略),可以是2,1-3,2 5等。
info display打印自动显示的表达式列表,每个表达式都带有项目编号,但不显示其值。info reg显示当前寄存器信息。info threads打印出所有线程的信息,包含 Thread ID、Target ID 和 Frame。info frame打印出指定栈帧的详细信息。info proc查看 proc 里的进程信息。
disable -- dis
禁用断点,参数使用空格分隔。不带参数时禁用所有断点。
disable [breakpoints] [list…]breakpoints是disable的子命令(可省略),list…同info breakpoints中的描述。
enable
启用断点,参数使用空格分隔。不带参数时启用所有断点。
enable [breakpoints] [list…]启用指定的断点(或所有定义的断点)。enable [breakpoints] once list…临时启用指定的断点。GDB 在停止您的程序后立即禁用这些断点。enable [breakpoints] delete list…使指定的断点启用一次,然后删除。一旦您的程序停止,GDB 就会删除这些断点。等效于用tbreak设置的断点。
breakpoints 同 disable 中的描述。
clear
在指定行或函数处清除断点。参数可以是行号,函数名称或 * 跟一个地址。
clear当不带参数时,清除所选栈帧在执行的源码行中的所有断点。clear <function>,clear <filename:function>删除在命名函数的入口处设置的任何断点。clear <line>,clear <filename:line>删除在指定的文件指定的行号的代码中设置的任何断点。clear <address>清除指定程序指令的地址处的断点。
delete -- d
删除断点。参数使用空格分隔。不带参数时删除所有断点。
delete [breakpoints] [list…]
tbreak
设置临时断点。参数形式同 break 一样。当第一次命中时被删除。
watch
为表达式设置观察点。每当一个表达式的值改变时,观察点就会停止执行您的程序。
watch [-l|-location] <expr>如果给出了-l或者-location,则它会对expr求值并观察它所指向的内存。
另外 rwatch 表示在访问时停止,awatch 表示在访问和改变时都停止。
step -- s
单步执行程序,直到到达不同的源码行。
step [N]参数N表示执行 N 次(或由于另一个原因直到程序停止)。
reverse-step
反向步进程序,直到到达另一个源码行的开头。
reverse-step [N]参数N表示执行 N 次(或由于另一个原因直到程序停止)。
next -- n
单步执行程序,执行完子程序调用。
next [N]
与 step 不同,如果当前的源代码行调用子程序,则此命令不会进入子程序,而是继续执行,将其视为单个源代码行。
reverse-next
反向步进程序,执行完子程序调用。
reverse-next [N]
如果要执行的源代码行调用子程序,则此命令不会进入子程序,调用被视为一个指令。
return
您可以使用 return 命令取消函数调用的执行。如果你给出一个表达式参数,它的值被用作函数的返回值。
return <expression>将expression的值作为函数的返回值并使函数直接返回。
finish -- fin
执行直到选定的栈帧返回。
finish
until -- u
执行程序直到大于当前栈帧或当前栈帧中的指定位置(与 break 命令相同的参数)的源码行。此命令常用于通过一个循环,以避免单步执行。
until <location>继续运行程序,直到达到指定的位置,或者当前栈帧返回。
continue -- c
在信号或断点之后,继续运行被调试的程序。
continue [N]
如果从断点开始,可以使用数字 N 作为参数,这意味着将该断点的忽略计数设置为 N - 1(以便断点在第 N 次到达之前不会中断)。
print -- p
求表达式 expr 的值并打印。可访问的变量是所选栈帧的词法环境,以及范围为全局或整个文件的所有变量。
print [expr]print /f [expr]通过指定/f来选择不同的打印格式,其中f是一个指定格式的字母
x
检查内存。
x/nfu <addr>x <addr>n,f, 和u都是可选参数,用于指定要显示的内存以及如何格式化。addr是要开始显示内存的地址的表达式。n重复次数(默认值是 1),指定要显示多少个单位(由u指定)的内存值。f显示格式(初始默认值是x),显示格式是print('x','d','u','o','t','a','c','f','s')使用的格式之一,再加i(机器指令)。u单位大小,b表示单字节,h表示双字节,w表示四字节,g表示八字节。
display
每次程序停止时打印表达式 expr 的值。
display <expr>display/fmt <expr>display/fmt <addr>
fmt 用于指定显示格式。对于格式 i 或 s,或者包括单位大小或单位数量,将表达式 addr 添加为每次程序停止时要检查的内存地址。
disassemble -- disas
反汇编命令。
disas <func>反汇编指定函数disas <addr>反汇编某地址所在函数disas <begin_addr> <end_addr>反汇编从开始地址到结束地址的部分
undisplay
取消某些表达式在程序停止时自动显示。参数是表达式的编号(使用 info display 查询编号)。不带参数表示取消所有自动显示表达式。
disable display
禁用某些表达式在程序停止时自动显示。禁用的显示项目被再次启用。参数是表达式的编号(使用 info display 查询编号)。不带参数表示禁用所有自动显示表达式。
enable display
启用某些表达式在程序停止时自动显示。参数是重新显示的表达式的编号(使用 info display 查询编号)。不带参数表示启用所有自动显示表达式。
help -- h
打印命令列表。
help <class>您可以获取该类中各个命令的列表。help <command>显示如何使用该命令的简述。
attach
挂接到 GDB 之外的进程或文件。将进程 ID 或设备文件作为参数。
attach <process-id>
run -- r
启动被调试的程序。可以直接指定参数,也可以用 set args 设置(启动所需的)参数。还允许使用 >, <, 或 >> 进行输入和输出重定向。
甚至可以运行一个脚本,如:
run `python2 -c 'print "A"*100'`
backtrace -- bt
打印整个栈的回溯。
bt打印整个栈的回溯,每个栈帧一行。bt n类似于上,但只打印最内层的 n 个栈帧。bt -n类似于上,但只打印最外层的 n 个栈帧。bt full n类似于bt n,还打印局部变量的值。
注意:使用 gdb 调试时,会自动关闭 ASLR,所以可能每次看到的栈地址都不变。
ptype
打印类型 TYPE 的定义。
ptype[/FLAGS] TYPE-NAME | EXPRESSION
参数可以是由 typedef 定义的类型名, 或者 struct STRUCT-TAG 或者 class CLASS-NAME 或者 union UNION-TAG 或者 enum ENUM-TAG。
set follow-fork-mode
当程序 fork 出一个子进程的时候,gdb 默认会追踪父进程(set follow-fork-mode parent),但也可以使用命令 set follow-fork-mode child 让其追踪子进程。
另外,如果想要同时追踪父进程和子进程,可以使用命令 set detach-on-fork off(默认为on),这样就可以同时调试父子进程,在调试其中一个进程时,另一个进程被挂起。如果想让父子进程同时运行,可以使用 set schedule-multiple on(默认为off)。
但如果程序是使用 exec 来启动了一个新的程序,可以使用 set follow-exec-mode new(默认为same) 来新建一个 inferior 给新程序,而父进程的 inferior 仍然保留。
thread apply all bt
打印出所有线程的堆栈信息。
generate-core-file
将调试中的进程生成内核转储文件。
directory -- dir
设置查找源文件的路径。
或者使用 gdb 的 -d 参数,例如:gdb a.out -d /search/code/
gdb-peda
当 gdb 启动时,它会在当前用户的主目录中寻找一个名为 .gdbinit 的文件;如果该文件存在,则 gdb 就执行该文件中的所有命令。通常,该文件用于简单的配置命令。但是 .gdbinit 的配置十分繁琐,因此对 gdb 的扩展通常用插件的方式来实现,通过 python 的脚本可以很方便的实现需要的功能。
PEDA(Python Exploit Development Assistance for GDB)是一个强大的 gdb 插件。它提供了高亮显示反汇编代码、寄存器、内存信息等人性化的功能。同时,PEDA 还有一些实用的新命令,比如 checksec 可以查看程序开启了哪些安全机制等等。
安装
安装 peda 需要的软件包:
$ sudo apt-get install nasm micro-inetd
$ sudo apt-get install libc6-dbg vim ssh
安装 peda:
$ git clone https://github.com/longld/peda.git ~/peda
$ echo "source ~/peda/peda.py" >> ~/.gdbinit
$ echo "DONE! debug your program with gdb and enjoy"
如果系统为 Arch Linux,则可以直接安装:
$ yaourt -S peda
peda命令
aslr-- 显示/设置 gdb 的 ASLRasmsearch-- Search for ASM instructions in memoryasmsearch "int 0x80"asmsearch "add esp, ?" libc
assemble-- On the fly assemble and execute instructions using NASMassembleassemble $pc > mov al, 0xb > int 0x80 > end
checksec-- 检查二进制文件的安全选项cmpmem-- Compare content of a memory region with a filecmpmem 0x08049000 0x0804a000 data.mem
context-- Display various information of current execution contextcontext_code-- Display nearby disassembly at $PC of current execution contextcontext_register-- Display register information of current execution contextcontext_stack-- Display stack of current execution contextcontext regcontext codecontext stack
crashdump-- Display crashdump info and save to filedeactive-- Bypass a function by ignoring its execution (eg sleep/alarm)deactive setresuiddeactive chdir
distance-- Calculate distance between two addressesdumpargs-- 在调用指令停止时显示传递给函数的参数dumpmem-- Dump content of a memory region to raw binary filedumpmem libc.mem libc
dumprop-- 在特定的内存范围显示 ROP gadgetsdumpropdumprop binary "pop"
eflags-- Display/set/clear/toggle value of eflags registerelfheader-- 获取正在调试的 ELF 文件的头信息elfheaderelfheader .got
elfsymbol-- 从 ELF 文件中获取没有调试信息的符号信息elfsymbolelfsymbol printf
gennop-- Generate abitrary length NOP sled using given charactersgennop 500gennop 500 "\x90"
getfile-- Get exec filename of current debugged processgetpid-- Get PID of current debugged processgoto-- Continue execution at an addresshelp-- Print the usage manual for PEDA commandshexdump-- Display hex/ascii dump of data in memoryhexdump $sp 64hexdump $sp /20
hexprint-- Display hexified of data in memoryhexprint $sp 64hexprint $sp /20
jmpcall-- Search for JMP/CALL instructions in memoryjmpcalljmpcall eaxjmpcall esp libc
loadmem-- Load contents of a raw binary file to memoryloadmem stack.mem 0xbffdf000
lookup-- 搜索属于内存范围的地址的所有地址/引用lookup address stack libclookup pointer stack ld-2
nearpc-- Disassemble instructions nearby current PC or given addressnearpc 20nearpc 0x08048484
nextcall-- Step until next 'call' instruction in specific memory rangenextcall cpy
nextjmp-- Step until next 'j*' instruction in specific memory rangenextjmp
nxtest-- Perform real NX test to see if it is enabled/supported by OSpatch-- 使用字符串/十六进制字符串/整形数patch $esp 0xdeadbeefpatch $eax "the long string"patch (multiple lines)
pattern-- 生成,搜索或写入循环 pattern 到内存pattern_arg-- Set argument list with cyclic patternpattern_create-- Generate a cyclic patternpattern_env-- Set environment variable with a cyclic patternpattern_offset-- Search for offset of a value in cyclic patternpattern_patch-- Write a cyclic pattern to memorypattern_search-- Search a cyclic pattern in registers and memorypattern create 2000pattern create 2000 inputpattern offset $pcpattern searchpattern patch 0xdeadbeef 100
payload-- Generate various type of ROP payload using ret2pltpayload copybytespayload copybytes target "/bin/sh"payload copybytes 0x0804a010 offset
pdisass-- Format output of gdb disassemble command with colorspdisass $pc /20
pltbreak-- Set breakpoint at PLT functions match name regexpltbreak cpy
procinfo-- 显示调试进程的 /proc/pid/procinfoprocinfo fd
profile-- Simple profiling to count executed instructions in the programpyhelp-- Wrapper for python built-in helppyhelp pedapyhelp hex2str
pshow-- 显示各种 PEDA 选项和其他设置pshowpshow option context
pset-- 设置各种 PEDA 选项和其他设置pset arg '"A"*200'pset arg 'cyclic_pattern(200)'pset env EGG 'cyclic_pattern(200)'pset option context "code,stack"pset option badchars "\r\n"
readelf-- 获取 ELF 的文件头信息readelf libc .text
refsearch-- Search for all references to a value in memory rangesrefsearch "/bin/sh"refsearch 0xdeadbeef
reload-- Reload PEDA sources, keep current options untouchropgadget-- 获取二进制或库的常见 ROP gadgetsropgadgetropgadget libc
ropsearch-- 搜索内存中的 ROP gadgetsropsearch "pop eax"ropsearch "xchg eax, esp" libc
searchmem|find-- 搜索内存中的 pattern; 支持正则表达式搜索find "/bin/sh" libcfind 0xdeadbeef allfind "..\x04\x08" 0x08048000 0x08049000
searchmem-- Search for a pattern in memory; support regex searchsession-- Save/restore a working gdb session to file as a scriptset-- Set various PEDA options and other settingsset exec-wrapper ./exploit.py
sgrep-- Search for full strings contain the given patternshellcode-- 生成或下载常见的 shellcodeshellcode x86/linux exec
show-- Show various PEDA options and other settingsskeleton-- 生成 python exploit 代码模板skeleton argv exploit.py
skipi-- Skip execution of next count instructionssnapshot-- Save/restore process's snapshot to/from filesnapshot savesnapshot restore
start-- Start debugged program and stop at most convenient entrystepuntil-- Step until a desired instruction in specific memory rangestepuntil cmpstepuntil xor
strings-- Display printable strings in memorystringsstrings binary 4
substr-- Search for substrings of a given string/number in memorytelescope-- Display memory content at an address with smart dereferencestelescope 40telescope 0xb7d88000 40
tracecall-- Trace function calls made by the programtracecalltracecall "cpy,printf"tracecall "-puts,fflush"
traceinst-- Trace specific instructions executed by the programtraceinst 20traceinst "cmp,xor"
unptrace-- Disable anti-ptrace detectionunptrace
utils-- Miscelaneous utilities from utils modulevmmap-- 在调试过程中获取段的虚拟映射地址范围cmmapvmmap binary / libcvmmap 0xb7d88000
waitfor-- Try to attach to new forked process; mimic "attach -waitfor"waitforwaitfor myprog -c
xinfo-- Display detail information of address/registersxinfo register eaxxinfo 0xb7d88000
xormem-- 用一个 key 来对一个内存区域执行 XOR 操作xormem 0x08049000 0x0804a000 “thekey”
xprint-- Extra support to GDB's print commandxrefs-- Search for all call/data access references to a function/variablexuntil-- Continue execution until an address or function
使用 PEDA 和 Python 编写 gdb 脚本
- 全局类
pedacmd:- 交互式命令
- 没有返回值
- 例如:
pedacmd.context_register()
peda:- 与 gdb 交互的后端功能
- 有返回值
- 例如:
peda.getreg("eax")
- 小工具
- 例如:
to_int()、format_address() - 获得帮助
pyhelp pedapyhelp hex2str
- 例如:
- 单行/交互式使用
gdb-peda$ python print peda.get_vmmap()gdb-peda$ python > status = peda.get_status() > while status == "BREAKPOINT": > peda.execute("continue") > end
- 外部脚本
# myscript.py
def myrun(size):
    argv = cyclic_pattern(size)
    peda.execute("set arg %s" % argv)
    peda.execute("run")
gdb-peda$ source myscript.py gdb-peda$ python myrun(100)
更多资料
GEF/pwndbg
除了 PEDA 外还有一些优秀的 gdb 增强工具,特别是增加了一些查看堆的命令,可以看情况选用。
- GEF - Multi-Architecture GDB Enhanced Features for Exploiters & Reverse-Engineers
- pwndbg - Exploit Development and Reverse Engineering with GDB Made Easy